Teiko saves your scientists time and effort by streamlining data processing and analysis, ensuring organized and reliable results. Our advantage is we knit all the pieces together: specimen collection, tracking, panels, report validation, and data delivery. In data delivery, we provide an analytical pipeline that transforms complex cytometry data into actionable insights.
Our analytical pipeline provides automated statistical analysis with access via a web app built upon a relational database. This enables you to spend more time finding answers to clinical trials. Reproducing our analytical pipeline (unit testing, relational database, and continuous integration/delivery), could take the better part of a year. Instead, insights are unlocked within weeks. With our focus on continuous integration and continuous deployment, you will also benefit from our ongoing enhancements in visualization, statistical analysis, and clustering.
If you work with us, you gain access to a team dedicated to optimizing and managing your data pipeline, freeing your informatics team to focus on other critical tasks. With automated unit-testing, peer-reviewed changes, and modern software engineering practices, we ensure that our process is not only reliable but also transparent and fully trackable.
Why not just use flat files?
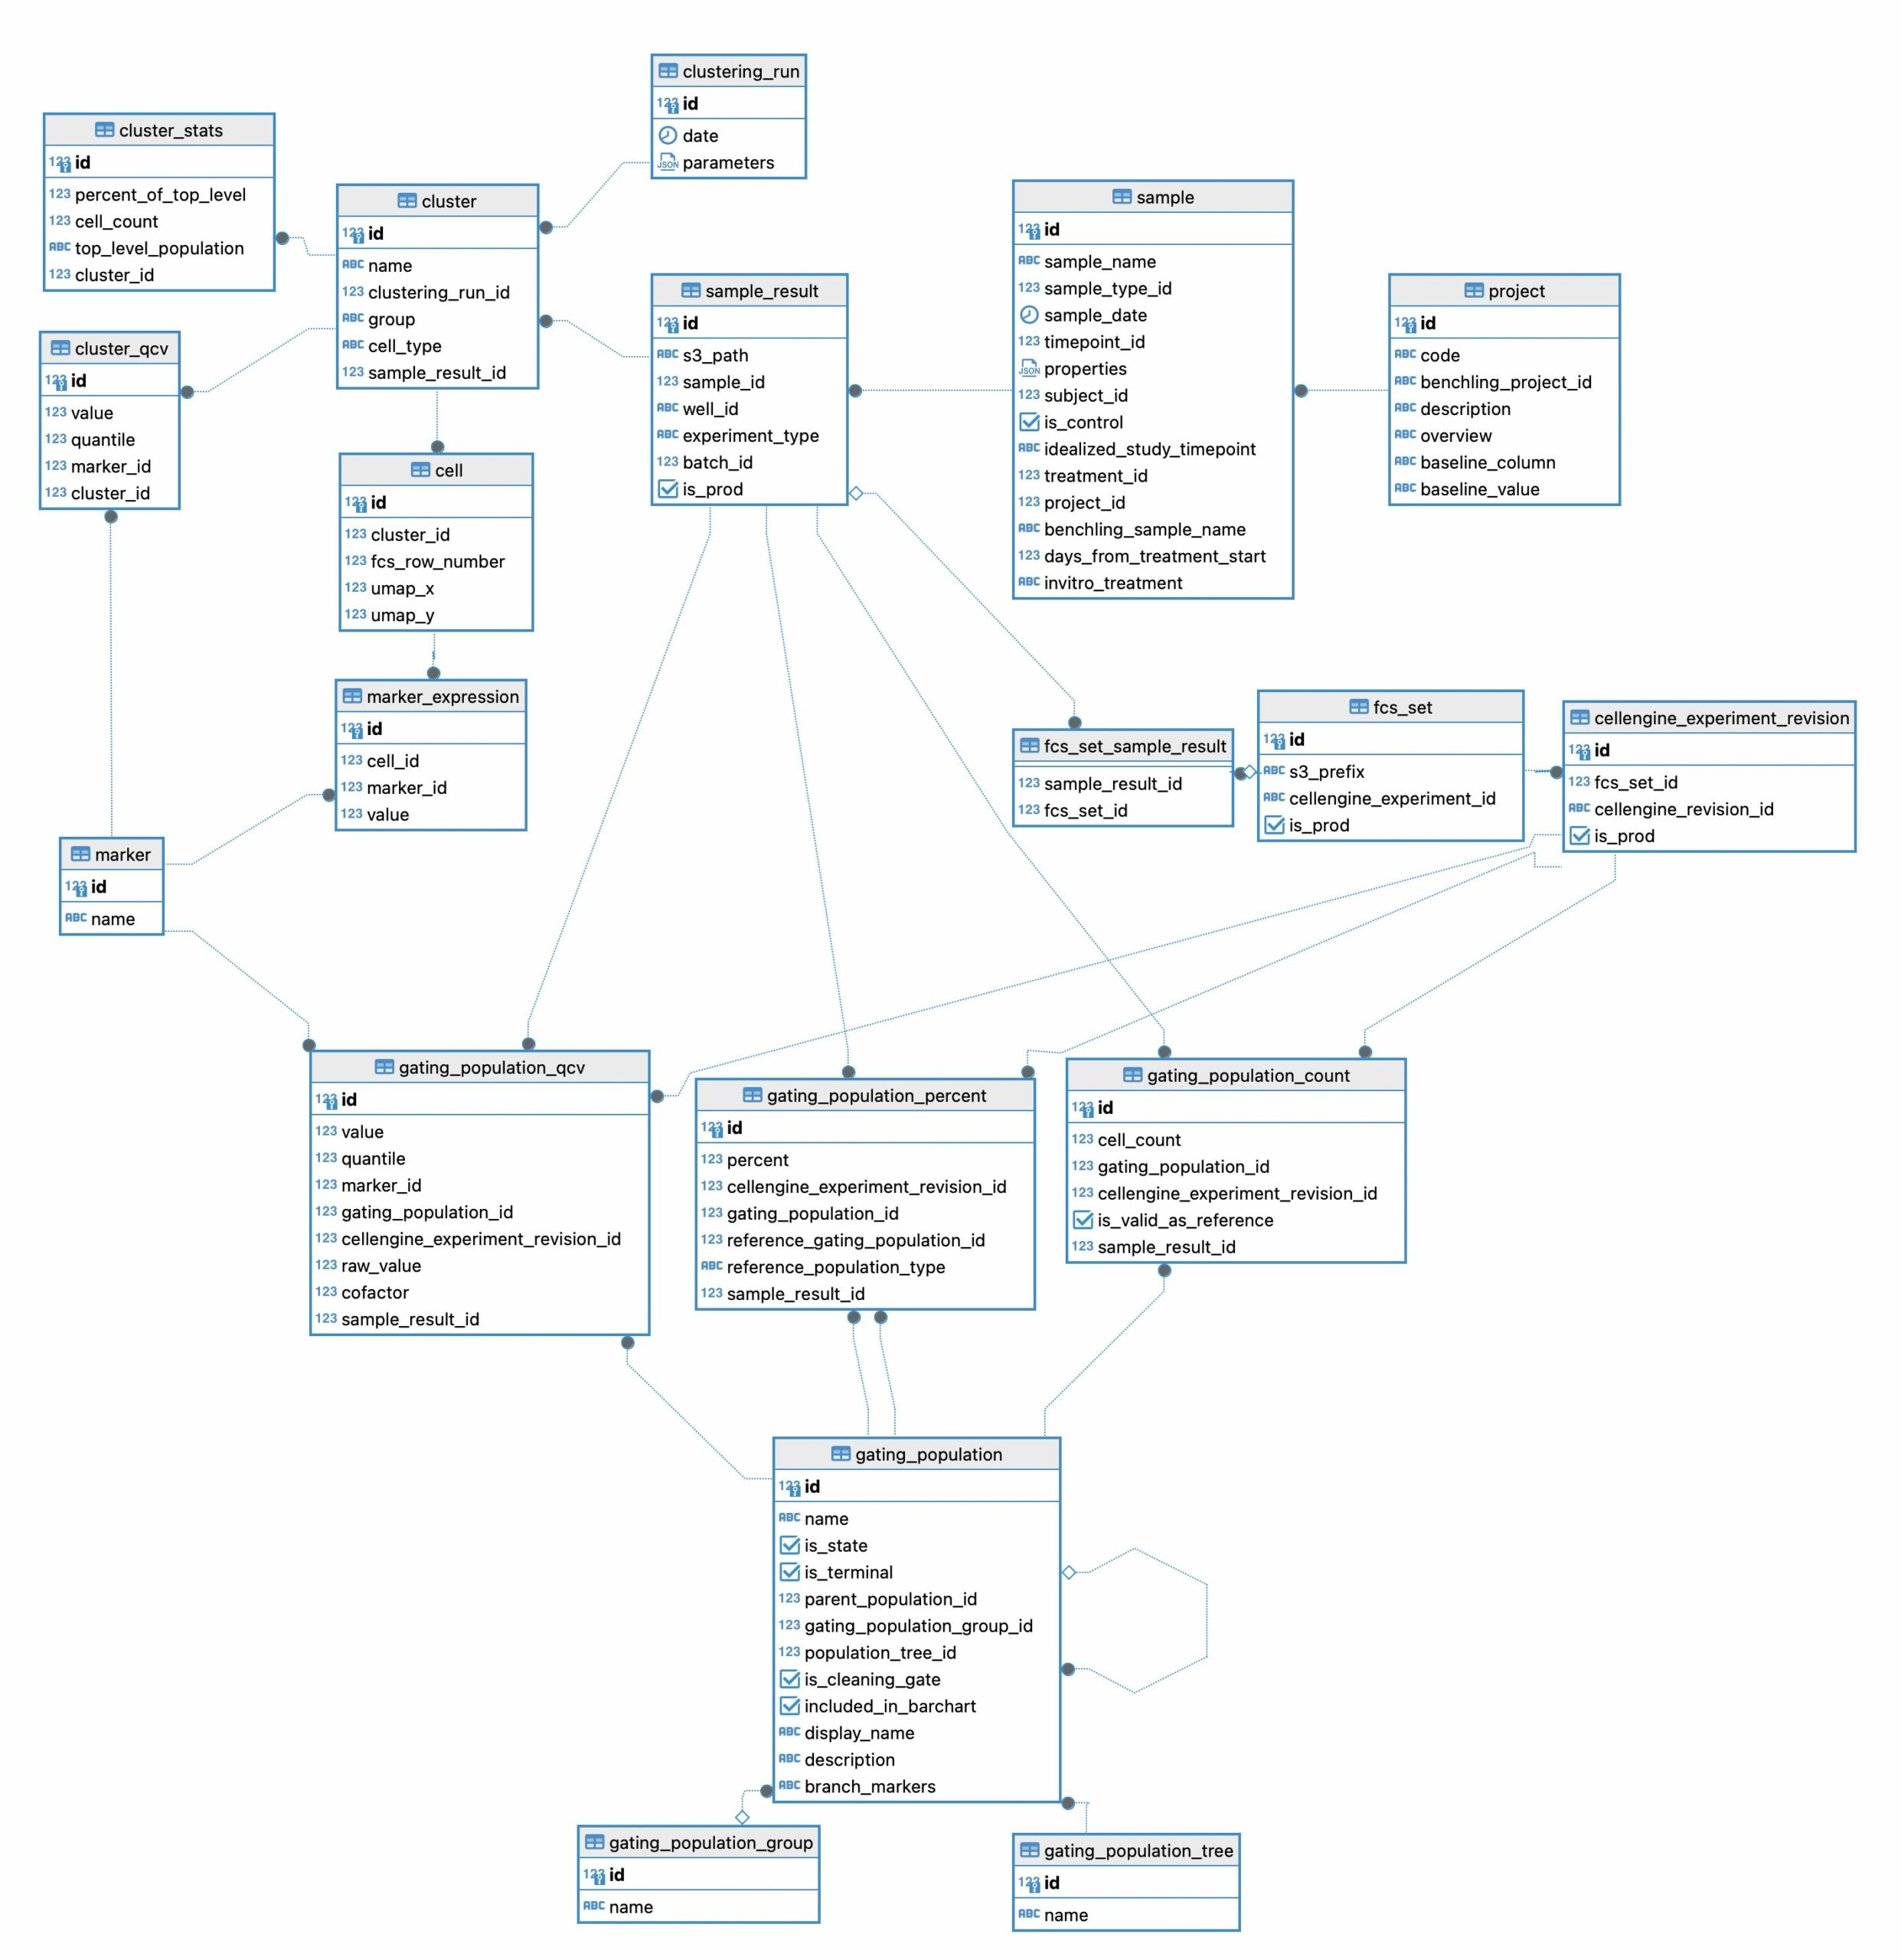
To receive and digest data from complex, high-dimensional datasets, we implemented an analytical pipeline to extract, transform, and load this information into a relational database. The design of the relational database is crucial for high performance and rapid data extraction. Our approach ensures efficient data handling, scalability, and ease of querying. In Figure 1 we show the design of just a single portion of our relational database. This diagram shows the tables used to manage clustering results and gating statistics.
One of the major false economies of relying on flat files instead of a relational database is the initial perception of simplicity and lower cost. While flat files may seem straightforward and cost-effective for small-scale projects, they quickly become a liability as data complexity and volume increase.
Flat files often suffer from slow access times, limited ability to handle concurrent queries, and increased risk of data corruption. This makes flat files inefficient for large-scale data operations. The lack of scalability and difficulty in managing data integrity can lead to significant delays and errors in data processing. In contrast, a well-designed relational database supports rapid data retrieval while maintaining data integrity. The upfront investment Teiko has made in a relational database system is offset by the long-term gains in efficiency, reliability, and scalability. This provides you with a sustainable solution for high-dimensional data analysis.
For example, consider a research team using a flat file to store data from a large-scale clinical trial. As the data grows, they notice accessing specific subsets of the data becomes increasingly slow. Also running complex queries requires substantial manual effort.
With our design complex queries such as:
- “At day 42, is there a statistically significant decrease in state marker HLA-DR median channel value within B cells in complete responders but not in Partial or Non-Responders?”, or
- “Among cohort 3 samples, do we see a statistically significant increase in B-cells between day 2 and day 3?”
…are answered easily.
Here’s a comparison between a flat file methodology and a relational database:
| Feature | Flat File | Relational Database |
| Complexity | Simple | Highly Complex |
| Time cost | Low | Initially high |
| Suitability | Suitable for small scale data analysis | Suitable for high-dimensional data analysis |
| Access time | Slow | Rapid |
| Data corruption risk | High risk | Maintains consistency and integrity |
| Scalability | Poor | Highly scalable |
| Data integrity management | Difficult | Efficient and reliable |
| Long term efficiency | Inefficient for large-scale operations | Gains in efficiency overtime |
| Reliability | Prone to errors and delays | Highly reliable |
| Sustainability | Increase in liability as data complexity grows | Robust and sustainable solution |
| Collaboration | Difficult | Designed for concurrent access |
How complex is the data, and can I trust your statistical approach?
We can free up weeks or months of time for your clinical and translational teams. One of the biggest complaints we hear from drug developers using conventional flow cytometry vendors is, “How am I supposed to analyze this data?”
For an average clinical project where 162 samples are run through our pipeline, the gated data alone returns approximately 160,000 data points. These 160,000 data points result in approximately one million statistical comparisons for three doses across nine timepoints. This can easily double or triple as the number of endpoints increase. Imagine comparing adverse events, responder vs non responder, and complex dosing regimens. For even experienced informatics teams going from raw data to analysis can take weeks, with queues as long as months. With Core and Premier, analysis is delivered alongside the raw data, and we execute the statistical analysis automatically.
To showcase the complexity of the high dimensional data, our Immune Differences (marker expression) data table returns approximately 550 plots. Each plot shows the median channel expression of markers on all cell types. We perform statistical analysis and apply multiple test corrections to the results. This is crucial because as the number of tests increases, the probability of false positives also increases. Multiple test correction prevents false positives from being reported as significant results.
Accessing these results is easy with our user interface, allowing rapid drill-down on significant findings. In Figure 2 we show the experience using the web-app to rapidly identify significant results. On our web-app it is simple to toggle between a paired and an unpaired analysis. Initially there are no significant differences from the unpaired analysis, but once the user returns a paired analysis multiple results are returned as significant.
Why are you confident in the analytical software?
Every step of our analytical pipeline is tested and organized into software packages. We employ automated unit-tests. Each function has a unit-test, which acts as a piece of code that tests the hypothesis of the original code. Unit-tests prove that the code performs as expected, which is why testing is crucial. Just like in science, proving the hypothesis is core to ensuring reliability.
For instance, consider our function convert_dataset_to_statistical_input, which converts data for statistical analysis. One unit test checks whether the function correctly handles cases where some values are missing in the input data. The test test_convert_gating_dataset_to_statistical_test_input_negative intentionally provides a dataset with missing values. If the function tries to process this data, it should raise a ValueError indicating which samples are missing. This unit test would catch issues during development, ensuring that our pipeline correctly identifies and handles missing data before it causes problems in a real-world analysis.
Another example is preparing tallies for statistical analysis. Tallies are composition of subjects and the definition of whether the statistic should be paired or unpaired. Our function generate_tallies has a unit-test called generate_tallies_for_paired_with_no_subject_pairs. The function should return a warning that no tally could be generated. If the function produces a tally, then the software is malfunctioning and the function that intakes this output would fail. This test protects other parts of the software from breaking.
| Example Test | Quick Scripts | Software Infrastructure |
| Statistical tests require at least 100 events | Difficult to know accuracy of results | Built-in |
| Tallies for paired statistics, but have subjects in both timepoints | Difficult to detect downstream process that will break | Built-in |
Automated unit-testing provides assurance that changes made do not break other parts of the codebase. If a piece of code requires an update, but this update causes ten tests in an unrelated portion of the codebase to fail, we are alerted at the time of implementation. This prevents breaking other parts of the codebase. This ensures that the web-app is always functioning when needed.
All code at Teiko has changes tracked. Using modern software engineering practices, all pieces of code have a history of changes that can be observed. This provides information about who made the changes and an easy way to roll back changes if needed. Compare this described experience to the experience in a point-and-click platform like Excel.
What about just doing the analysis in spreadsheets?
In Excel, an analyst makes a spreadsheet with complex operations that produce fast visualizations. However:
- How are changes reviewed? Changes are often not reviewed, but occasionally it is required for the delivering party to show the underlying formulas. Describing and understanding the formulas are difficult in spreadsheets as one often needs to double-click the formulas to understand what data is being used.
- How are changes tracked? In modern cloud architectures, all files are tracked every time a change is made. However, the shared Excel workbook used by the entire organization can change without review, or a copy of the book can be used elsewhere, leading to discrepancies. An example would be an excel workbook with a sheet of raw data. If a user accidentally adds a value to one cell, this change is hard to find and can completely change the result of the analysis.
Why not use Flowjo, GraphPad or off the shelf?
These are amazing power tools, but they are not integrated with a lab, and these solutions are not totally automatable. Using our offering, you’ll automatically get the most advanced cytometry analyses for clinical trials.
Batch normalization: Imagine samples that arrive across multiple batches. You then need to figure out which batch normalization technique to apply. We’ve performed the research to select the most appropriate normalization algorithms. We also provide a Quality Control (QC) assessment of the normalization, and we post these reports through our integrated web-app.
Clustering algorithms: The magnitude of the data can cause most standard clustering algorithms to choke, or run up a large computation bill. Teiko tracks the state of the art and implements fast, reliable, and cost effective algorithms.
Trackable or reviewable experience: When running another analysis using tools like GraphPad or Flowjo, users must remember all the clicks and configurations applied. In contrast, with us you can just login and drill-down on answers to your clinical trial.
You can try to implement a do-it-yourself, but it comes with a real time and maintenance cost. Does this sound interesting to you? Contact us and let us know if we can support your clinical trial.