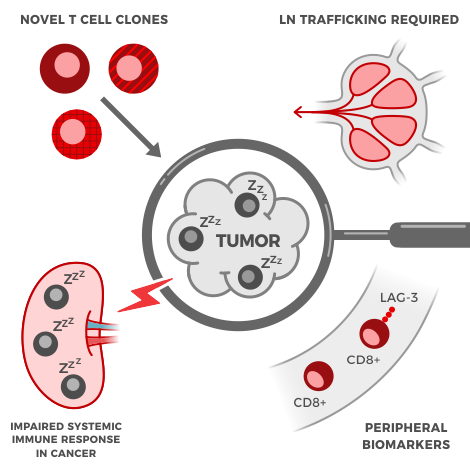
Immunotherapies are powerful new drugs that harness the immune system’s power to cure cancer, without the side effects of chemotherapy. To design these, drug developers need more powerful tools to understand the complex symphony of immune cells and their functions. But with hundreds of cell types and a long list of important parameters, it can be hard to gather enough data to see the full picture.
For decades, researchers have used cytometry to identify, characterize, and sort immune cells into their many distinct subsets. This technology has come a long way from the original single-parameter instrument, and cytometry has diversified into three detection-based methods: flow, spectral, and mass cytometry.
We highlight the differences between these three technologies below to help you figure out which best suits your research and therapeutic development needs.
Page Anchor: #flow-cytometry – Not Visible On Front Flow Cytometry: a workhorse for looking at a handful of markers
The process of flow cytometry involves incubating cells with fluorescent-tagged antibodies against unique cellular protein markers. With careful selection of antibodies and fluorophores, a researcher can detect on average 10-12 unique cellular markers at a time. Using these markers, they can identify a handful of different immune cell types, as well as identify a small number of features about the cell’s activation, function, or memory status.
One of the traditional flow cytometers biggest assets is speed: it can sort as many as 50,000 cells per second. This speed means that flow cytometry can collect enough cell events to identify even rare cell types.
Despite its speed, conventional flow cytometry has several major limitations. The biggest limitation is in the number of parameters that can be measured simultaneously. With a limited number of detectors and broad emission spectra of many fluorophores the overlap becomes difficult to distinguish beyond a dozen markers.
While flow cytometry can collect enough data to detect rare cells, the limited number of markers means it can’t provide much information about those cells. Dividing a single sample across multiple panels is one potential workaround, but it’s not an option for precious samples or those with low cell counts.
Page Anchor: #spectral-flow-cytometry – Not Visible On Front Spectral Flow Cytometry: more markers, but limited customization
Like conventional flow cytometry, spectral flow cytometry uses fluorochrome-conjugated antibodies to label cells. However, instead of measuring the light emission using a single detector for each fluorophore, spectral cytometry captures the full fluorescence spectrum for all fluorophores on each cell.
The use of full fluorescence spectra also means that researchers can use closely related dyes in large panels. These overlapping spectra are then un-mixed using proprietary software and algorithms. This allows scientists to capture more parameters per experiment, on average about twice as many as traditional flow cytometry with a maximum of 40 parameters .
While full-spectrum flow cytometry can measure more parameters per experiment than conventional flow cytometry, the method still has limitations. Multiplexing to 40 parameters is possible, but it requires extensive panel optimization to achieve. Although spectral unmixing allows fluorophores with similar peak emissions to be used in the same panel, the spectra can still influence each other in the unmixing, and must be carefully validated. While spectral unmixing can accommodate sample autofluorescence, considerations must be made to optimize marker resolution in complex tissues. The algorithms used to perform this spectral unmixing are also something of a black box, making it more challenging to interpret results.
Page Anchor: #mass-cytometry – Not Visible On Front Mass cytometry: more customization, requires special expertise
Mass cytometry combines the precision of mass spectrometry with the power of flow cytometry by allowing scientists to easily measure 44 different parameters simultaneously without the need for spectral compensation or unmixing. This means scientists can identify 25+ different immune cell subsets and profile cellular activation, exhaustion, and function using a single panel.
Instead of using fluorophores, mass cytometry utilizes metal isotopes to label antibodies. Most platforms use heavy metals as these do not naturally occur in biological systems. Instead of detecting fluorescence spectra, this system uses a time-of-flight mass spectrometer for detection which can quickly and efficiently differentiate isotopes without any loss of signal clarity. Since each metal has a distinct isotopic value instead of a broad spectrum, mass cytometry does not require the compensation or spectral unmixing needed for conventional and full-spectrum flow cytometry, respectively.
The approach does have some drawbacks, including slower throughput than flow cytometry. The cells are also vaporized during acquisition, which prevents the cells from being utilized in downstream analyses. Despite these drawbacks, mass cytometry is quickly becoming the go-to platform for immune profiling and biomarker validation due to its ease of panel customization, high-number of parameters per panel, and sensitive mass spectrometry-based detection method.
Page Anchor: #which-cytometry-platform-is-right-for-you – Not Visible On Front Which Technique is Right For You?
All three techniques are used in both academic and industry labs, occasionally in tandem!
Flow cytometry is a good choice for those interested in profiling a handful of immune cell types or for looking at a handful of markers on a single cell type.
Spectral cytometry is a good choice for those interested in profiling more cell types and who plan on using the same or similar panels with limited changes between experiments.
Mass cytometry is a good choice for those interested in profiling the full immune landscape, those with limited or precious samples, or those who prefer the ease of panel customization that mass spectrometry-based detection methods can provide.
Where to go for help
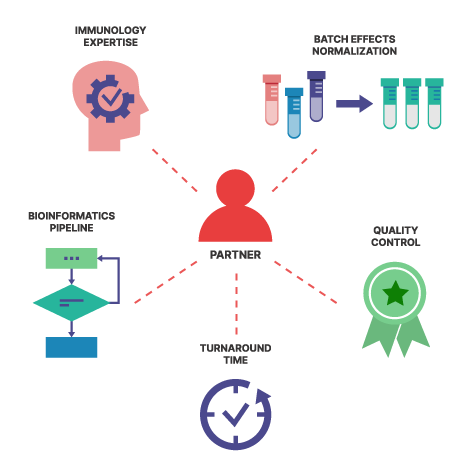
At Teiko, our end-to-end platform utilizes mass cytometry as it allows us to easily customize our 35-marker base panels with up to 12 additional custom markers tailored to each customer project. Our team has over a decade of experience in every stage of mass cytometry analysis including panel development, sample processing, computational analysis and data interpretation. Our scientists have also previously worked with conventional flow cytometry and spectral flow cytometry platforms and are available to answer your questions about our experiences with all three.