Each antibody on Teiko’s cytometry panels goes through a multi-step verification process to ensure that the selected concentration gives the optimal marker detection without spilling into neighboring channels. The process for any antibody starts with a six-point concentration series, beginning at 6 ug/mL, followed by performing two-fold dilutions down to 0.1875 ug/mL to create six distinct concentrations.
For each concentration, we measure the median channel values (like median fluorescence intensity in flow cytometry) and the standard deviation of the channel values for each marker in the cell populations that express (positive population) and do not express (negative population) the given marker. These measurements allow us to calculate a Staining Index (SI) for each concentration. The SI is a key metric in cytometry, indicating the antibody’s ability to distinguish between positive and negative populations.
When comparing staining indices, the goal is to select the concentration with the highest staining index. However, when staining indices are similar, we also look at the visual separation between positive and negative populations using the dot plot on the gating scheme, spillover into the +1, -1, and +16 channels, and the median channel value of the positive population at each concentration. A +1 channel refers to the isotope with a molecular weight one unit higher than the metal isotope bound to the antibody, while a -1 channel refers to the isotope one unit lower. We check the +16 channel to ensure the metal has not oxidized.
We will take you through our process for determining the optimal staining concentration for three markers on our mass cytometry panel: CD25 (surface marker), Granzyme B (cytoplasmic marker), and Tbet (intranuclear marker). Each marker on Teiko’s backbone panels has been verified using this process, and any custom marker requested by a client—whether for our Custom or StandardPlus mass cytometry panels—will undergo the same verification.
CD25 – Surface Marker
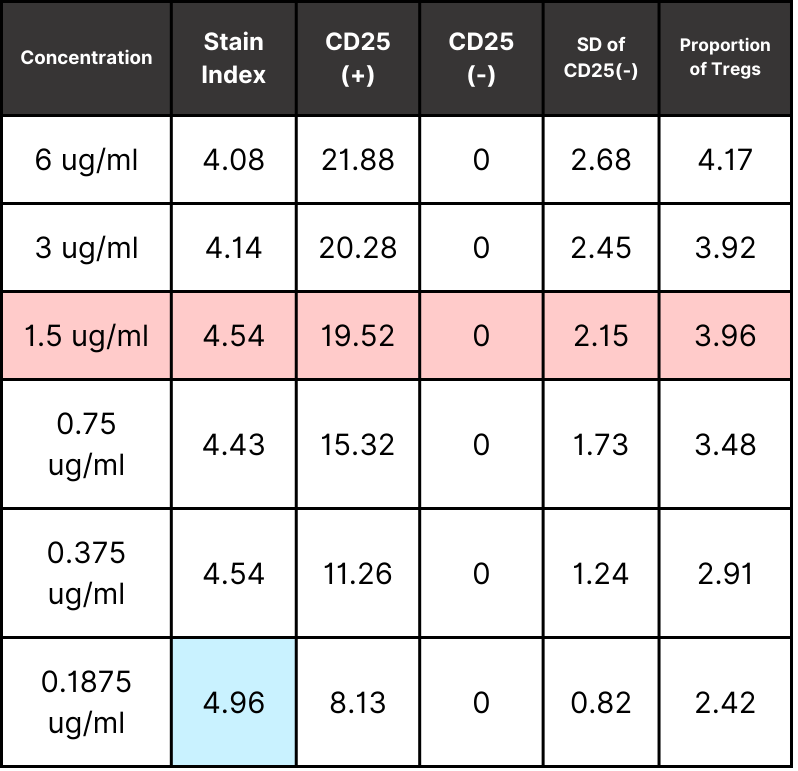
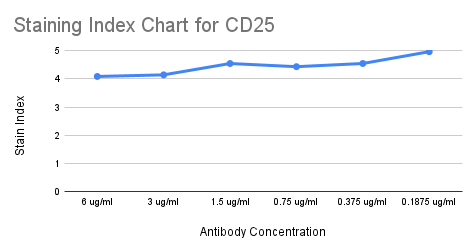
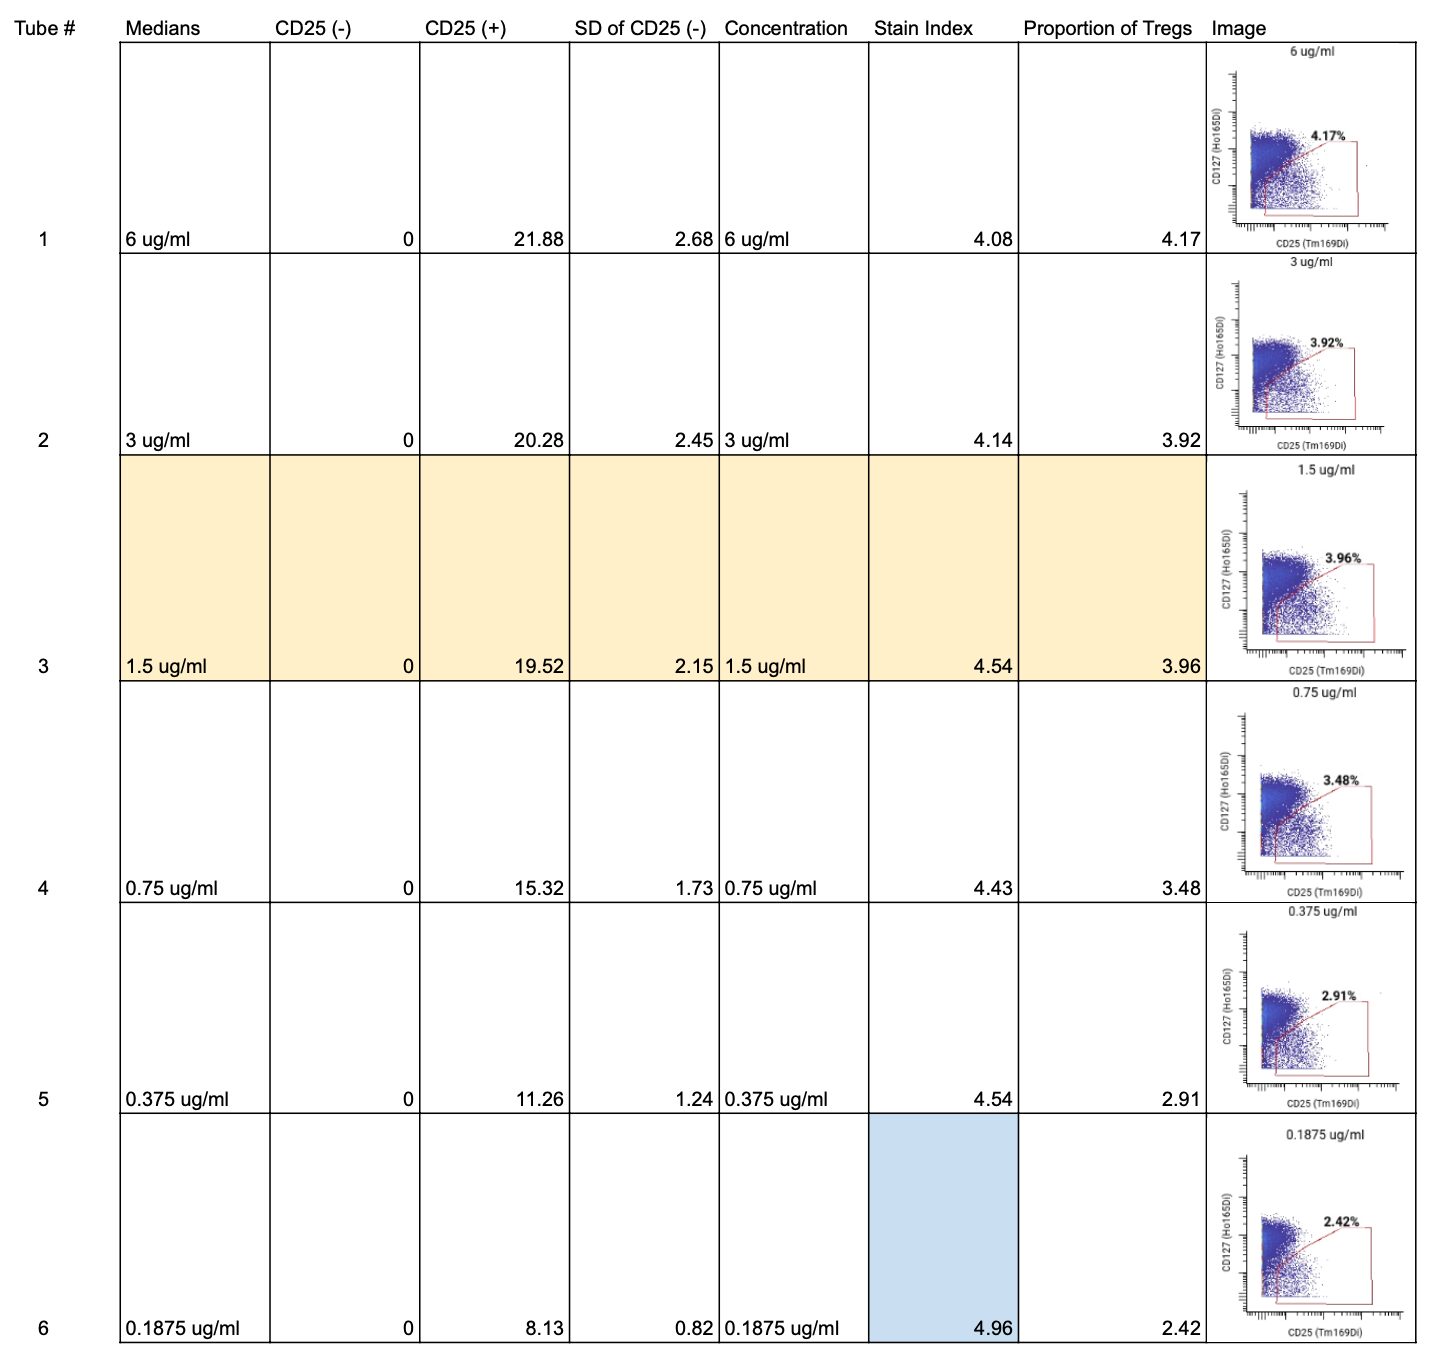
For CD25, we started by calculating the SI for each of the six concentrations. We found the highest SI was at 0.1875 ug/mL (highlighted in blue on the full staining chart below), however, because the stain indices were similar for all concentrations, we wanted to ensure that this antibody would have a clear separation between total T cells and regulatory T cells (Tregs) when gating.
To do so, we looked at the frequencies of Tregs within the CD25+ and CD127lo gate to find the lowest antibody concentration that still gave a consistent proportion of Tregs and clear separation between Tregs and non-Treg T cells. We found that at 1.5 ug/mL, the Treg frequency was similar to that found at higher antibody concentrations, but the 1.5 ug/mL concentration also had a higher stain index.

We then checked the MCV for the positive population at each concentration. We aim for values between 10 and 100, ideally somewhere in the middle, to keep all markers on the panel within a similar range. All concentrations above 0.1875 ug/mL were within this range.

Lastly, looked at signal spillover into the +1 and -1 metal channels to ensure no signal from the CD25 channel was interfering with the other nearby channels. For spillover, the lower the percentage of positive cells in the neighboring channel, the better. We found that no spillover occurred at concentrations below 3 ug/mL.
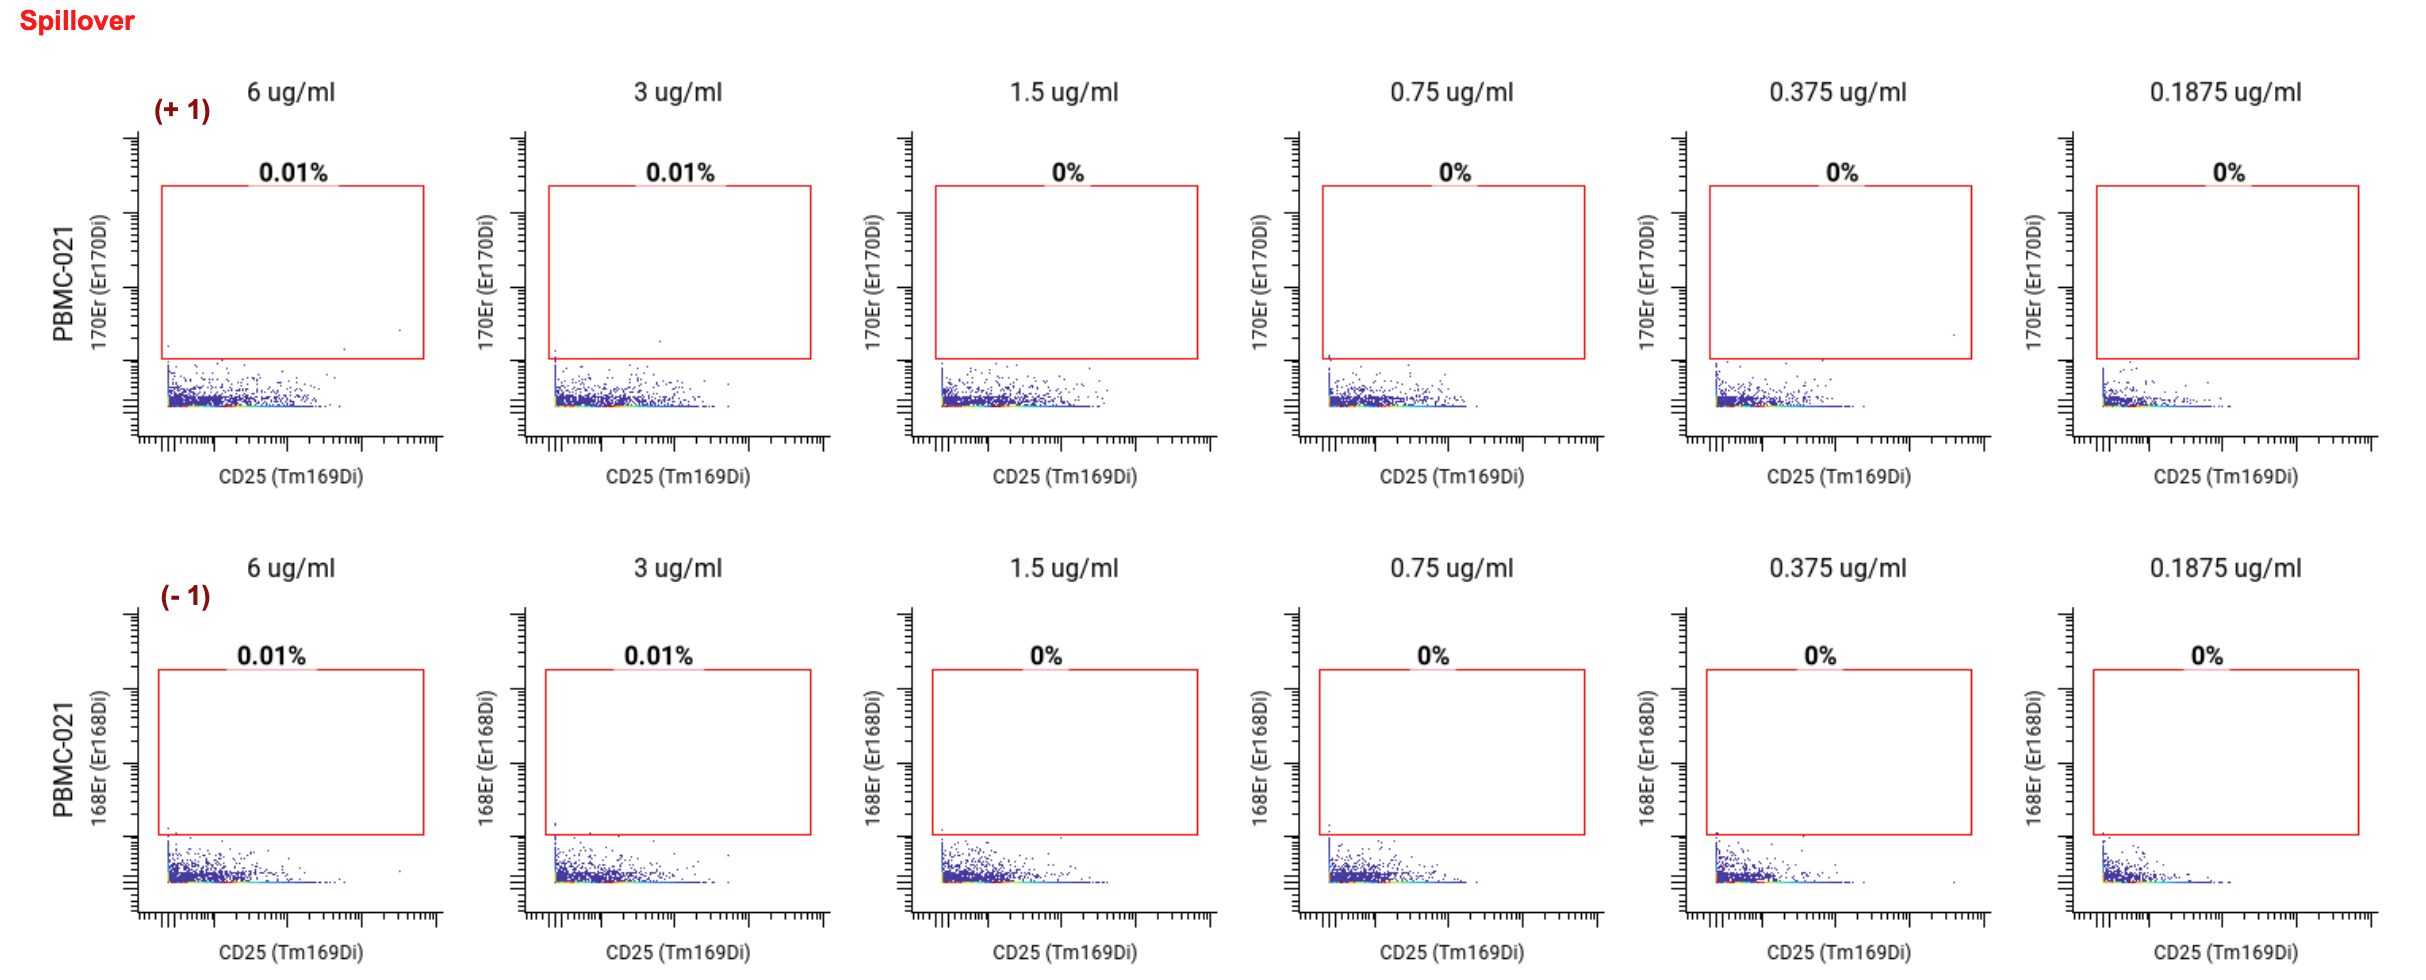
Ultimately, we selected 1.5 ug/mL as the optimal concentration for CD25 (highlighted in yellow on the staining chart below), because of the high SI, clear separation between Tregs and non-Tregs, and no spillover into neighboring channels. ✅
Granzyme B – cytoplasmic marker
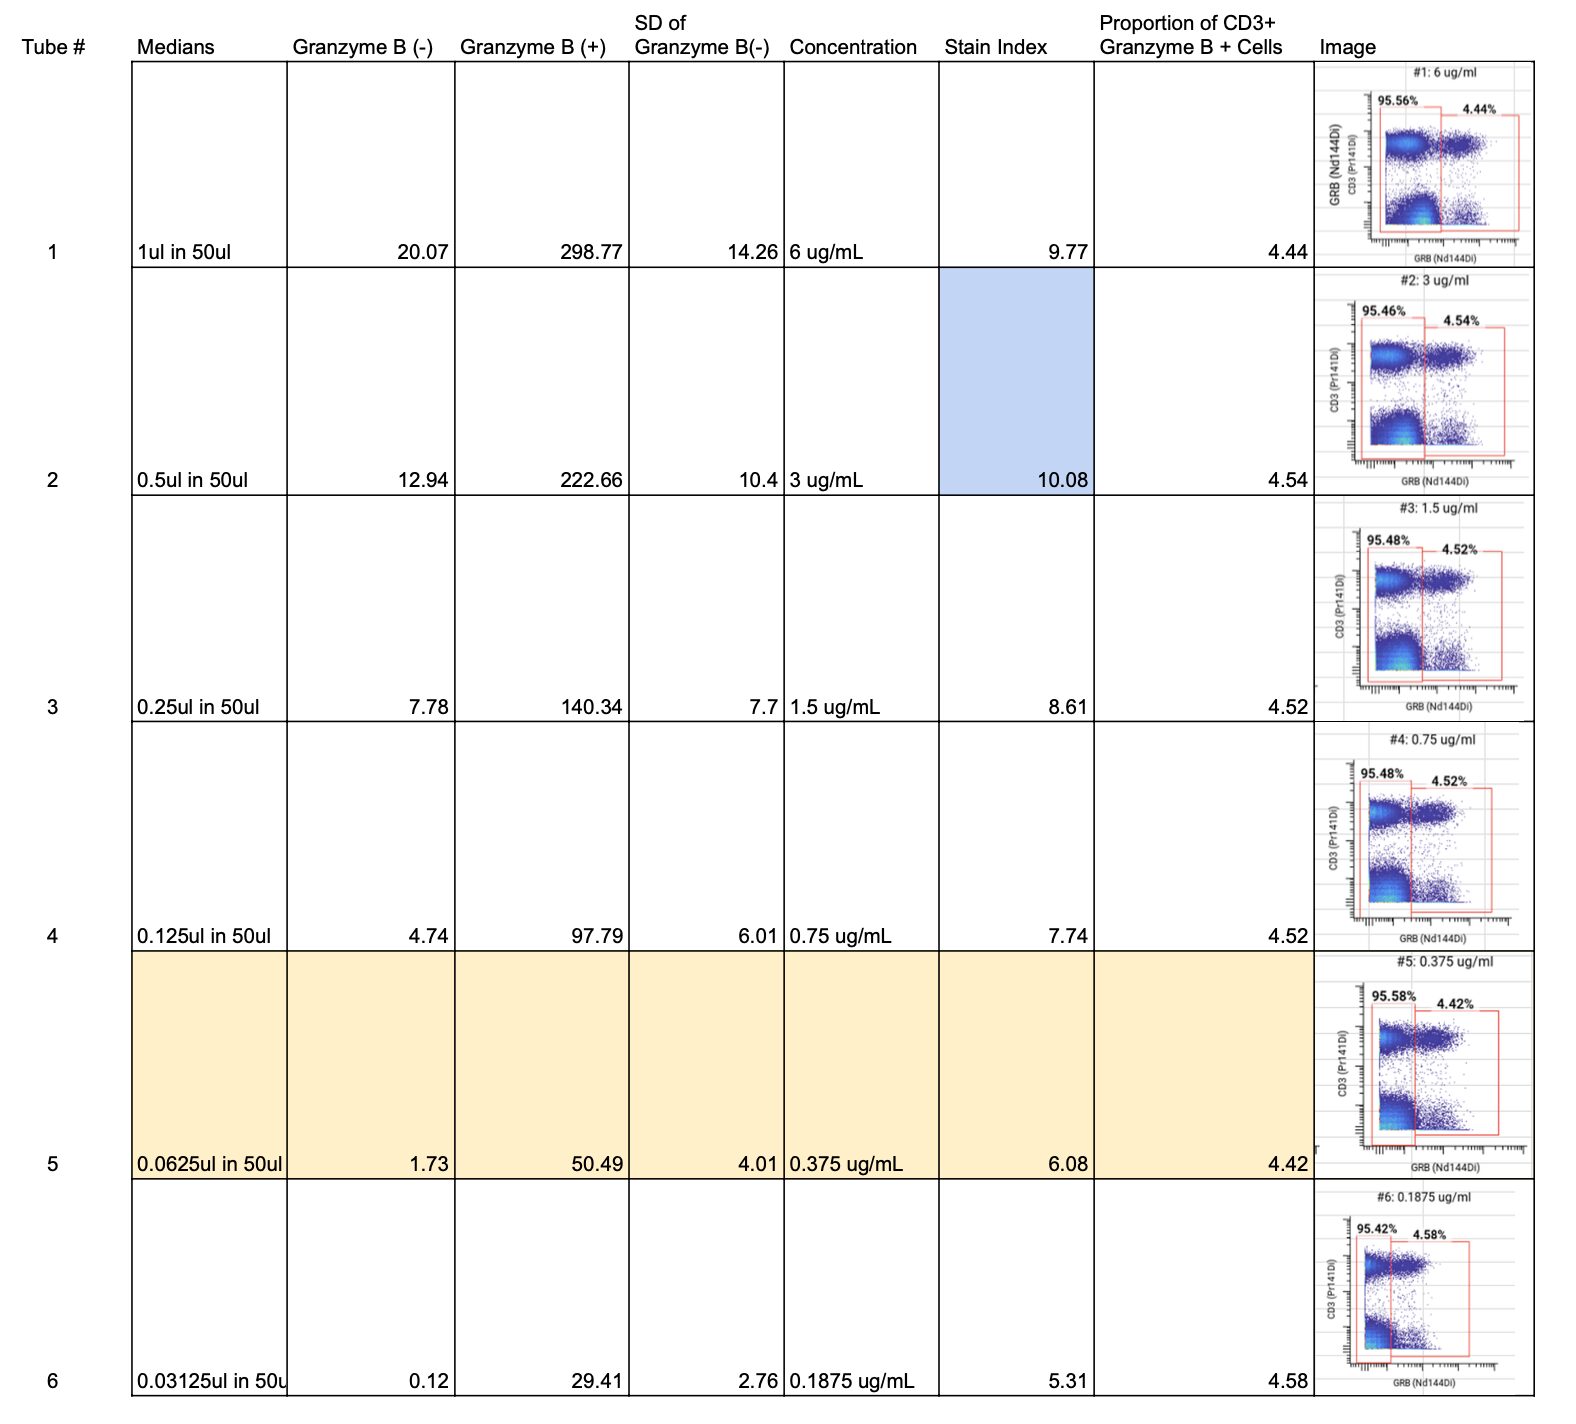
For Granzyme B, a cytoplasmic marker, we looked at the SIs for each of the 6 concentrations and found that 3 ug/mL had the highest SI (highlighted in blue on the full staining chart below).
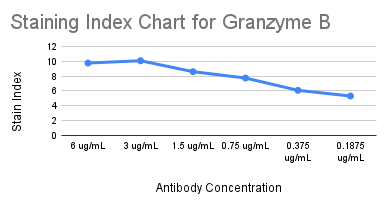
Although 3 ug/mL had the highest SI, the MCVs for 3 ug/mL, 6 ug/mL, and 1.5 ug/mL were higher than 100, which put the channel at risk of spilling over into neighboring channels since the signal is so bright.

We then looked at the spillover into the +1, -1, and +16 channels. We noticed spillover at all concentrations above 0.75 ug/mL.

To ensure that we could distinguish between Granzyme B-positive and negative populations we looked at the gating schemes across all concentrations. 0.375 ug/mL still had a distinct separation between positive and negative populations while minimizing spillover.

We selected 0.375 ug/mL as the optimal concentration for Granzyme B (highlighted in yellow on the full staining chart below) because it was the concentration with the highest SI at which we did not observe any spillover into neighboring channels. ✅
Tbet – Intranuclear Marker
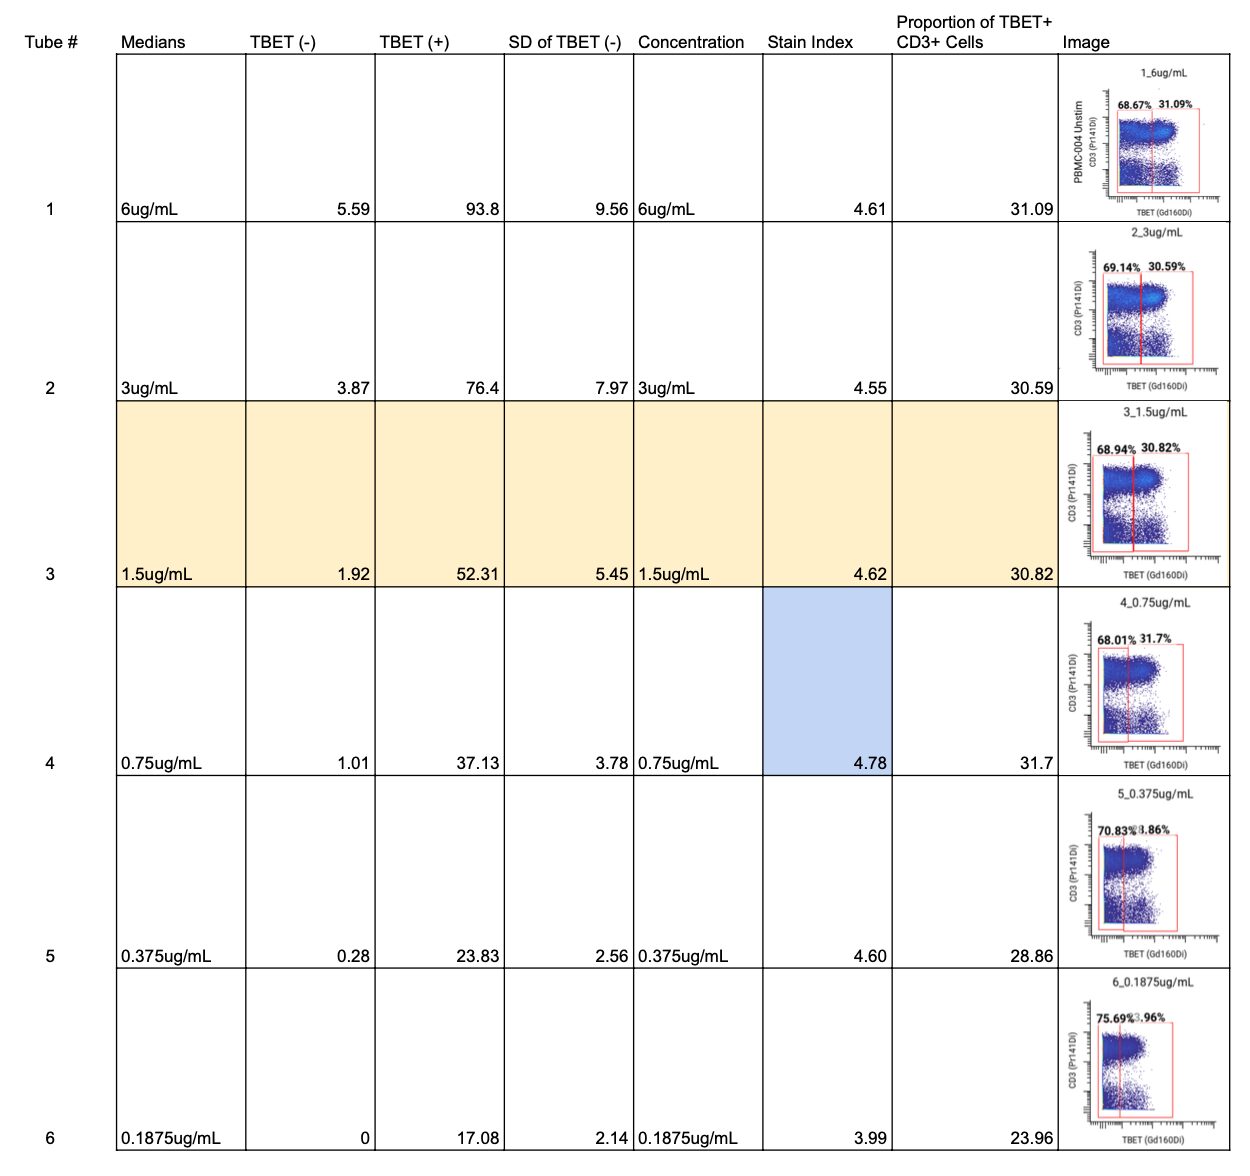
For Tbet, an intranuclear marker, we followed a similar process, starting with a 6-point titration from 6 µg/mL to 0.1875 µg/mL. We calculated an SI for each concentration and looked for the concentration with the highest SI.
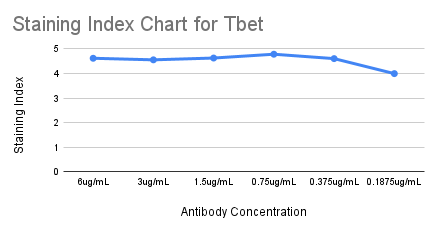
For Tbet, that was 0.75 µg/mL (highlighted in blue on the full staining chart below), but the SIs were similar between 6 and 0.375 µg/mL. We also compared the frequencies of the positive and negative cell populations, which remained consistent across concentrations.

After that, we examined the MCVs of the positive populations, looking for concentrations with values between 10 and 100. For Tbet, we observed a median channel value of 50 at 1.5 µg/mL.

Lastly, we checked for spillover into the +1, -1, and +16 metal channels to ensure no signal interference. We confirmed no spillover into channels 159 (-1), 161 (+1), or 176 (+16) across all concentrations.

We selected 1.5 µg/mL as the optimal concentration (highlighted in yellow on the full staining chart below) because of its high SI, clear separation between Tbet+ and Tbet- populations in gating, its median channel value of 50 which indicates a sufficiently positive population, and no spillover into neighboring channels. ✅
