High-parameter cytometry has transformed our ability to analyze cell populations by increasing resolution of many subsets, yet the traditional reliance on fresh specimens remains largely unchallenged. The range in stability profiles of different cell subsets, particularly rare populations, necessitate a systematic evaluation of cellular stability. Time between collection and processing affects sample quality, with noticeable differences observed between samples analyzed immediately after collection compared to samples analyzed 72 hours after collection. To accurately determine the freshness of a sample, we propose the term “Fresh-hour”, designating specimens based on their post-collection processing interval, such as “Fresh-0” or “Fresh-72”.
To quantify how processing delays affect sample quality, we analyzed blood from three healthy donors. Each sample was split into four aliquots: one processed immediately after collection (Fresh-0), and the others processed 24, 48, and 72 hours after drawing (Fresh-24, Fresh-48, and Fresh-72, respectively). All aliquots for each Fresh-X timepoint were analyzed concurrently on a Cytek Aurora spectral flow cytometer. We compared the change in population frequencies at each Fresh-hour time point relative to the baseline, using a 25% change in frequency as the threshold for acceptable variance.
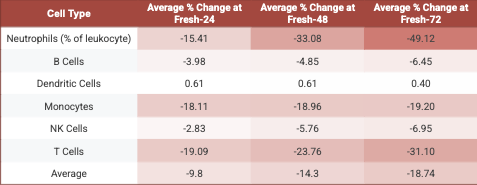
Our analysis showed a linear reduction in the number of live cells from Fresh-0 to Fresh-72, with a 48% reduction in the total cell number by Fresh-72. Cell loss varied by type, with neutrophils, T cells, and monocytes most affected. When comparing the percent of non-granulocyte between Fresh-0 and Fresh-72 for each cell type, we found that the percent of neutrophils decreased by 49%, T cells by 31%, and monocytes by 19% (Table 1).
To assess platform consistency, we evaluated populations from Fresh-3 to Fresh-51 on a Helios mass cytometer. By Fresh-51, all monocyte populations exceeded the 25% threshold. While most lymphocytes remained stable, rare subsets—including double-negative/positive T cells, CD4+ TEMRA, and specific NK and DC populations—showed significant changes.
These findings align with the Cytek 25-color immunoprofiling validation report, which found similar changes in rare populations by Fresh-72. Our study demonstrates that Fresh-72 samples differ significantly from Fresh-0 samples, challenging the assumption that all “fresh” specimens are equivalent in high-parameter cytometry.
Table 1. Cell population degradation across processing time points. Values show the average percent change of each cell type at Fresh-24, Fresh-48, and Fresh-72. Fresh-X indicates samples processed X hours after collection.