Teiko.bio

The complementary capabilities of single-cell RNA seq and high-dimensional cytometry

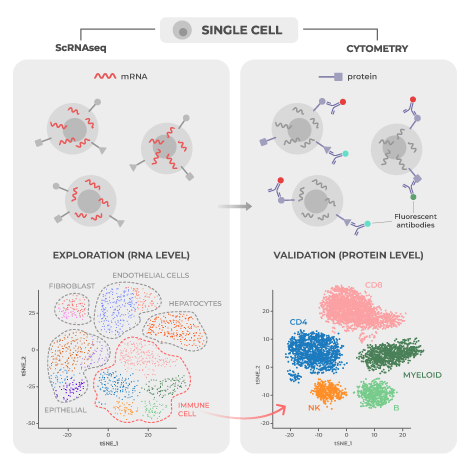
Single-cell RNA sequencing (scRNA-seq) and high-dimensional cytometry (i.e. spectral flow cytometry or mass cytometry), are both popular approaches for high dimensional analysis of disease states with single cell resolution. Individually, each is a powerful tool for determining the mechanisms underlying disease development and assessing response to treatment. When combined, however, the two can deeply enrich mechanistic and biomarker therapeutic research by providing complementary breadth and depth of analysis.

Researchers have used scRNAseq and high-dimensional cytometry as complementary tools in a wide variety of published studies to provide additional breadth, depth, and coverage when analyzing cellular processes.  Below are a few specific examples that illustrate the diversity and range of these approaches in a variety of biomedical research settings.

Page Anchor: #kashima-2021 – Not Visible On Front

Finding Cells of Interest in the Tumor Microenvironment

Comparison of scRNAseq data and CyTOF data taken from Figure 2a of Kashima et al. Sci Rep (2021) without alterations under the Creative Commons Attribution 4.0 International License. Full citation can be found under References below.

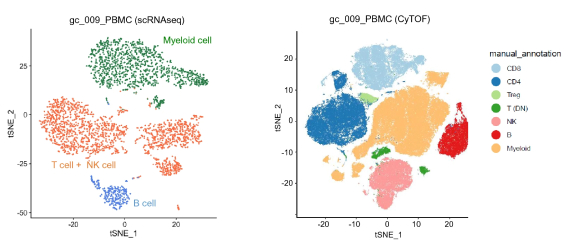
A study published in Scientific Reports by Kashima et al. in 2021 used both scRNA-seq and high-dimensional mass cytometry to investigate the immune profiles of the tumor microenvironment in gastric cancer patients.1 Because scRNA-seq was not limited by predetermined marker selection, it was able to detect and characterize new cell populations and subgroups within those populations. For example, scRNA-seq was able to identify plasma cells that were not defined by mass cytometry markers. In contrast, mass cytometry showed greater precision in differentiating predefined cell types characterized by a specific pattern of protein expression. For instance, NK cells and T cells were differentiated with greater accuracy using mass cytometry than with scRNA-seq.

As a result of their research, Kashimi et al. concluded that the greatest strength of high-dimensional mass cytometry lies in its ability to provide “narrow and clear” detection of prespecified cell types, while scRNA-seq enables “wide and indistinct” characterization of cells of interest. Thus, one approach for using the techniques together would be to apply scRNA-seq for discovery of new cell types of interest given the wide-breadth of this approach and then applying high-dimensional cytometry for more rapid and granular characterization of these cell types.

Page Anchor: #fernandez-zapata-2020 – Not Visible On Front

Brain Matters: Protein Provides the Persistent Signal

Fernández‐Zapata et al. published a review article in Brain Pathology in 2020 summarizing studies that made use of both high-dimensional mass cytometry and scRNA-seq to comprehensively analyze the structure and function of human microglia, the central nervous system’s native immune cells.3 ScRNA-seq was effectively utilized to characterize microglial subsets formed in response to CNS pathology, such as multiple sclerosis (MS).

A key point from the Fernández‐Zapata et al. article is that function is mediated at the protein level, and proteomic techniques like mass cytometry can directly measure protein expression, turnover, and post-translational modifications missed by scRNA-seq.  For example, the authors discovered that “for some molecules with low transcript levels such as CX3CR1, CSF1R and FCGR1A, [there was] no change or even an increase in protein expression.”  This means that for infrequently produced markers, measuring protein expression will provide a more accurate readout of the cell state. One should also be aware that there is also greater cellular “noise” in scRNA-seq since there are significant differences in gene expression from cell to cell at the level of mRNA transcription even in uniform cell populations.4  Transcription (mRNA production) occurs in pulses.5  ScRNA-seq captures a “snapshot” in the life of a cell that ebbs and flows in terms of transcription.  Lack of detection of a particular mRNA does not mean the cell never produces it, just that the cell does not require it at that specific point in time.  By contrast, proteins are longer-lived molecules allowing for a greater time span to detect them and to capture cell activity as cells transition from one state to another.

Page Anchor: #ha-2020 – Not Visible On Front

The Nanoparticle Nuisance

Nanoparticles are frequently added to consumer and biomedical products, and their interactions with human immune cells are important to characterize to ensure their safety. To address this topic, Ha et al. published a study in the journal Small in 2020 exploring the interactions between silver nanoparticles (AgNPs) and primary immune cells using both high-dimensional cytometry and scRNA-seq.2 Using mass cytometry, the study authors were able to show that monocytes and B cells had more contact with AgNPs than other cell populations. ScRNA-seq was then able to further characterize the specific cellular reactions in each cell type induced by contact with AgNPs.

In this study, mass cytometry was used as an initial screen for quick and accurate identification of cell subsets of interest that physically interacted with the specific nanoparticles being studied. It was able to directly detect the cell-AgNP interactions on a single cell level.  ScRNA-seq was then applied to obtain additional transcriptomic characterization taking place within the different cell types downstream of the interaction. In this instance the researchers were interested in AgNP-cell interactions, however a similar approach could be used to detect physical interactions between immune cells and any heavy metal labeled molecule.

Page Anchor: #technical-limitations – Not Visible On Front

Other Limitations to Consider

An additional consideration when applying scRNA-seq is to determine how “deep” or “shallow” the analysis should be, which will depend on time and budget constraints.1,6 A “shallow” analysis (low number of mRNAs read per cell relative to the total mRNA content of the cell) carries greater uncertainty about whether transcriptomic differences are due to biological processes or sampling variation. Deeper sequencing (reading more mRNA molecules) enables greater resolution in differentiating cells, but big-picture population dynamics can be lost. An initial “shallow” analysis is not necessarily a bad thing for early-stage exploration and mapping out broad networks and processes. Since mass cytometry is currently limited to around 45 parameters, it must cover a broad range of preselected protein markers that help to distinguish cell types amongst diverse populations. It is also constrained by the technical challenges involved in constructing marker-specific antibodies conjugated to metal-isotopes.1 On the flip side, the longer half-life of proteins means they go through fewer fluctuations in comparison to mRNA and thus are more stable and reliable cell markers.5 Furthermore, high-dimensional cytometry techniques like mass cytometry and spectral flow cytometry have higher throughput, with the ability to analyze hundreds of thousands or even millions of cells. Higher throughput translates to greater confidence that a complete picture of cell population changes is being captured.

Teiko Bio: A Natural Complement to scRNAseq

Whether using high-dimensional cytometry to identify large scale immune cell population changes, study subset interactions, explore specific subsets with greater depth and accuracy, or validate function at the protein level, high-dimensional cytometry with Teiko is a natural complement to scRNAseq.  Together the two techniques can form a powerful duo to accomplish your clinical research goals.

You Might Also Like

References

  1. Kashima Y, Togashi Y, Fukuoka S, Kamada T, Irie T, Suzuki A, Nakamura Y, Shitara K, Minamide T, Yoshida T, Taoka N. Potentiality of multiple modalities for single-cell analyses to evaluate the tumor microenvironment in clinical specimens. Scientific reports. 2021 Jan 11;11(1):1-1.
  2. Ha MK, Kwon SJ, Choi JS, Nguyen NT, Song J, Lee Y, Kim YE, Shin I, Nam JW, Yoon TH. Mass Cytometry and Single‐Cell RNA‐seq Profiling of the Heterogeneity in Human Peripheral Blood Mononuclear Cells Interacting with Silver Nanoparticles. Small. 2020 May;16(21):1907674.
  3. Fernández‐Zapata C, Leman JK, Priller J, Böttcher C. The use and limitations of single‐cell mass cytometry for studying human microglia function. Brain Pathology. 2020 Nov;30(6):1178-91
  4. Choi YH, Kim JK. Dissecting cellular heterogeneity using single-cell RNA sequencing. Molecules and cells. 2019 Mar 31;42(3):189.
  5. Gohil SH, Iorgulescu JB, Braun DA, Keskin DB, Livak KJ. Applying high-dimensional single-cell technologies to the analysis of cancer immunotherapy. Nature Reviews Clinical Oncology. 2021 Apr;18(4):244-56.
  6. Zhang MJ, Ntranos V, Tse D. Determining sequencing depth in a single-cell RNA-seq experiment. Nature communications. 2020 Feb 7;11(1):1-1.

Peripheral blood analysis is key to developing effective cancer immunotherapies

Research in the field of cancer immunotherapy increasingly demonstrates the value of studying circulating immune cells in peripheral blood to identify new therapeutic targets to enhance tumor-killing immune responses. Here we highlight a handful of impactful publications in this field and provide a strategy for implementing peripheral immune profiling in your research and drug development pipeline.

Page Anchor: #wu-2022 – Not Visible On Front

Fresh T cells from Blood Replenish Exhausted T Cells in Tumor to Sustain a Tumor-Killing Response

If tumor killing by immune cells happens at the tumor site, what is the role of the peripheral immune response in the effectiveness of immunotherapy treatments? Wu et al. address this important question in a Nature 2020 article.1 Cancer cells hide from immune cells using checkpoint proteins, such as PD-L1, that keep immune cell responses “in check.” Anti-PD-L1 monoclonal antibodies and others prevent cancer cells from doing this; they form a class of drugs known as immune checkpoint inhibitors.

The researchers used deep single-cell sequencing of RNA and T cell receptors to analyze the characteristics of different populations of T cells and T cell receptors in tumors, normal tissue next to the tumor (normal adjacent tissue), and peripheral blood.  Using these methods, the study authors were able to identify the location of targeted clonal expansion (replication of identical cells, called clones) of effector-like T cells, the specific subset of T cells that have direct anti-tumor activity.  Targeted clonal expansion within peripheral blood predicted local clonal expansion both within the tumor and in normal adjacent tissue at the same time, which was  associated with the drug working better.  

Data both from this study and others indicate that non-exhausted T cells (T cells that are fully functional and active) and T cell clones that travel from the periphery to the tumor play a central role in patients’ ability to fight off tumors after receiving immune checkpoint inhibitors.  Thus, identifying and analyzing tumor-killing T cells in peripheral blood samples is not only convenient but critical to drug discovery.  Therapeutic breakthroughs may be missed if peripheral blood analysis is ignored.

Page Anchor: #spitzer-2017 – Not Visible On Front

Reinforcements Needed: Effective Therapy Requires Immune Cells from Outside the Tumor

Teiko Bio’s cofounder Matt Spitzer and colleagues have published multiple studies demonstrating the importance of the peripheral immune response in cancer biology.  In these studies, the research was carried out using mass cytometry, an advanced technique that expands on flow cytometry technology by using metal-tagged antibodies.  Given the distinct characteristics of the metals used, mass cytometry has the capacity to detect more than 40 cellular markers simultaneously.

Prior to the publication by Wu et al., work by Spitzer et al. provided evidence that the peripheral immune system is the source of a prolonged and sustained tumor-killing response in their 2017 Cell paper.2 Using mass cytometry, the study authors investigated immune activity in a mouse model of triple-negative breast cancer following treatment with either a successful or unsuccessful immunotherapy.

The investigators found evidence of immune activity throughout the mouse’s body, not just in the tumor microenvironment.  During the period of tumor rejection, eight days after giving a successful therapy, only peripheral immune cells, such as those from draining lymph nodes, spleen, peripheral blood, or bone marrow, exhibited a higher level of activity and replication (production of new cells).  Furthermore, a specific subset of peripheral CD4+ T cells arose that provided immunity against new tumors, and their numbers grew in mice who responded to therapy. This peripheral immune activation was specific to successful therapy, as the peripheral immune cells of mice given an ineffective therapy showed very few immune differences when compared to untreated mice.

Overall, these findings suggest that a coordinated response engaging the entire immune system throughout the body is necessary to mount a persistent and effective tumor-killing response during treatment; simply activating immune cells within the tumor site is not enough.  Since peripheral blood samples provide information on the systemic immune response critical for developing effective immunotherapies, they should not be overlooked. 

Page Anchor: #allen-2020 – Not Visible On Front

Cancer’s Impact on the Immune System Goes Beyond Tumor-Killing

A 2020 study published in Nature Medicine by Allen et al. explored how cancer alters systemic immune response to infection.3 Eight mouse strains bioengineered to develop tumors across five tissue types were investigated. In all mice studied, cancer development caused marked changes in systemic immunity; similar findings were demonstrated using gene expression data of breast cancer patients from the Norwegian Women and Cancer Study. In the mice, the immune cell changes in peripheral tissues were distinct from those in the tumor microenvironment.

The presence of tumor in the mouse models weakened the immune response to infectious disease.  This manifested in many ways, including decreased T cell activity to fight off infections from viruses or bacteria.  Investigators discovered that T cell activity could be restored by supercharging the response of another type of immune cell, called the antigen-presenting cell.  When tumors were surgically removed, the healthy baseline functioning of the entire immune system was reestablished.  Antibody blockade of specific immune signaling molecules (IL-1 and G-CSF) alone prevented many of the negative tumor-induced changes to overall immune function.  This shows the importance of these signaling molecules to how the immune system dynamically changes and adapts to its environment.  Results from this study provide convincing evidence that dynamic restructuring of the entire immune system, both in terms of composition and function, occurs in response to cancer.

Page Anchor: #shen-2021 – Not Visible On Front

Peripheral Immune Profiling in Practice

How the immune system interacts with different types of cancer is now being studied for its potential as a predictive biomarker of response to treatment. Evidence for specific immune cell types guiding cancer progression, both positively or negatively, continues to build. A 2021 study by Shen et al. published in Science Translational Medicine found that certain immune protein identifiers (one of which is called lymphocyte-activation gene 3 or LAG-3 for short) on specific T cells (CD8+ T cells) predicted which patients would respond to immune checkpoint inhibitors.4 The researchers used flow cytometry to evaluate many different immune cell markers and the results were confirmed in two different patient data sets, one with melanoma (188 patients) and another with urothelial cancer. Both melanoma and urothelial cancer patients that had low levels of the LAG-3 immune biomarker on their CD8+ T cells were much more likely to respond to treatment.

A 2020 review paper published in Nature Reviews Cancer by Bruni, Angell, and Galon provides an outline of the primary immune factors that lead to tumors growing or shrinking.5 The importance of how the immune cell interacts with tumors can be seen in how checkpoint inhibitors work. If a robust adaptive anti-tumor immune response does not already exist before treatment, checkpoint inhibitors will be ineffective. There are many different cancer types, each having its own distinctive interactions with the immune system with many moving parts. Given this complexity, the authors of the review suggest that being able to predict how cancer patients respond to treatment can be improved by evaluating multiple immune parameters instead of relying on just one.

Page Anchor: #hartmann-2019 – Not Visible On Front

What to Look For When You Don’t Know What You’re Looking For

An article published in Cell Reports in 2019 explored the power of mass cytometry to overcome investigator bias and ensure detection of unexpected cellular activities in clinical trials.6 These unforeseen activities might provide the key to a therapeutic breakthrough even for trials with limited sample sizes. The study authors created a standardized, comprehensive reference panel of 33 antibodies that covers all major immune cells subsets in the innate and adaptive immune system, while also quantitatively measuring markers of activation and immune checkpoint molecules in one assay.

The mass cytometry panel was able to categorize at least 98% of peripheral immune cells, with each cell population expressing four or more antigens.  The strength of the technique was demonstrated in its ability to produce consistent results across two research centers and different sample types, including peripheral blood samples, metastatic lymph node samples, and tumor biopsies.  The investigators were able to characterize disease-associated immune signatures following bone marrow transplantation in leukemia patients who developed graft-versus-host disease compared to those who did not using their standardized 33 antibody reference panel. This published work formed the initial foundation for Teiko’s TokuProfile base panel, which was later optimized to add up to 12 additional open channels for customization. 

In summary, a growing body of evidence suggests that not only can studying immune system changes in peripheral blood in clinical trial cancer patients result in important insights , but peripheral immune responses are key to finding immunotherapy breakthroughs. High-dimensional techniques such as mass cytometry, with its ability to gather data on the entire immune landscape at once, are leading the charge and helping researchers find clinically relevant biomarkers today.

You Might Also Like

References

  1. Wu TD, Madireddi S, de Almeida PE, Banchereau R, Chen YJ, Chitre AS, Chiang EY, Iftikhar H, O’Gorman WE, Au-Yeung A, Takahashi C. Peripheral T cell expansion predicts tumour infiltration and clinical response. Nature. 2020 Mar;579(7798):274-8.
  2. Spitzer MH, Carmi Y, Reticker-Flynn NE, Kwek SS, Madhireddy D, Martins MM, Gherardini PF, Prestwood TR, Chabon J, Bendall SC, Fong L. Systemic immunity is required for effective cancer immunotherapy. Cell. 2017 Jan 26;168(3):487-502.
  3. Allen BM, Hiam KJ, Burnett CE, Venida A, DeBarge R, Tenvooren I, Marquez DM, Cho NW, Carmi Y, Spitzer MH. Systemic dysfunction and plasticity of the immune macroenvironment in cancer models. Nature medicine. 2020 Jul;26(7):1125-34.
  4. Shen R, Postow MA, Adamow M, Arora A, Hannum M, Maher C, Wong P, Curran MA, Hollmann TJ, Jia L, Al-Ahmadie H. LAG-3 expression on peripheral blood cells identifies patients with poorer outcomes after immune checkpoint blockade. Science translational medicine. 2021 Aug 25;13(608):eabf5107.
  5. Bruni D, Angell HK, Galon J. The immune contexture and Immunoscore in cancer prognosis and therapeutic efficacy. Nature Reviews Cancer. 2020 Nov;20(11):662-80.
  6. Hartmann FJ, Babdor J, Gherardini PF, Amir ED, Jones K, Sahaf B, Marquez DM, Krutzik P, O’Donnell E, Sigal N, Maecker HT, Meyer E, Spitzer MH, Bendall SC. Comprehensive Immune Monitoring of Clinical Trials to Advance Human Immunotherapy. Cell Rep. 2019 Jul 16;28(3):819-831.e4. doi: 10.1016/j.celrep.2019.06.049. PMID: 31315057; PMCID: PMC6656694.

Flow vs. Spectral vs. Mass Cytometry: What’s the difference?

Immunotherapies are powerful new drugs that harness the immune system’s power to cure cancer, without the side effects of chemotherapy. To design these, drug developers need more powerful tools to understand the complex symphony of immune cells and their functions. But with hundreds of cell types and a long list of important parameters, it can be hard to gather enough data to see the full picture.

For decades, researchers have used cytometry to identify, characterize, and sort immune cells into their many distinct subsets. This technology has come a long way from the original single-parameter instrument, and cytometry has diversified into three detection-based methods: flow, spectral, and mass cytometry. 

We highlight the differences between these three technologies below to help you figure out which best suits your research and therapeutic development needs.

Page Anchor: #flow-cytometry – Not Visible On Front

Flow Cytometry: a workhorse for looking at a handful of markers

The process of flow cytometry involves incubating cells with fluorescent-tagged antibodies against unique cellular protein markers. With careful selection of antibodies and fluorophores, a researcher can detect on average 10-12 unique cellular markers at a time. Using these markers, they can identify a handful of different immune cell types, as well as identify a small number of features about the cell’s activation, function, or memory status. 

One of the traditional flow cytometers biggest assets is speed: it can sort as many as 50,000 cells per second. This speed means that flow cytometry can collect enough cell events to identify even rare cell types. 

Despite its speed, conventional flow cytometry has several major limitations. The biggest limitation is in the number of parameters that can be measured simultaneously. With a limited number of detectors and broad emission spectra of many fluorophores the overlap becomes difficult to distinguish beyond a dozen markers. 

While flow cytometry can collect enough data to detect rare cells, the limited number of markers means it can’t provide much information about those cells. Dividing a single sample across multiple panels is one potential workaround, but it’s not an option for precious samples or those with low cell counts.

Page Anchor: #spectral-flow-cytometry – Not Visible On Front

Spectral Flow Cytometry: more markers, but limited customization

Like conventional flow cytometry, spectral flow cytometry uses fluorochrome-conjugated antibodies to label cells. However, instead of measuring the light emission using a single detector for each fluorophore, spectral cytometry captures the full fluorescence spectrum for all fluorophores on each cell. 

The use of full fluorescence spectra also means that researchers can use closely related dyes in large panels. These overlapping spectra are then un-mixed using proprietary software and algorithms. This allows scientists to capture more parameters per experiment, on average about twice as many as traditional flow cytometry with a maximum of 40 parameters .

While full-spectrum flow cytometry can measure more parameters per experiment than conventional flow cytometry, the method still has limitations. Multiplexing to 40 parameters is possible, but it requires extensive panel optimization to achieve. Although spectral unmixing allows fluorophores with similar peak emissions to be used in the same panel, the spectra can still influence each other in the unmixing, and must be carefully validated. While spectral unmixing can accommodate sample autofluorescence, considerations must be made to optimize marker resolution in complex tissues. The algorithms used to perform this spectral unmixing are also something of a black box, making it more challenging to interpret results.

Page Anchor: #mass-cytometry – Not Visible On Front

Mass cytometry: more customization, requires special expertise

Mass cytometry combines the precision of mass spectrometry with the power of flow cytometry by allowing scientists to easily measure 44 different parameters simultaneously without the need for spectral compensation or unmixing. This means scientists can identify 25+ different immune cell subsets and profile cellular activation, exhaustion, and function using a single panel.

Instead of using fluorophores, mass cytometry utilizes metal isotopes to label antibodies. Most platforms use heavy metals as these do not naturally occur in biological systems. Instead of detecting fluorescence spectra, this system uses a time-of-flight mass spectrometer for detection which can quickly and efficiently differentiate isotopes without any loss of signal clarity. Since each metal has a distinct isotopic value instead of a broad spectrum, mass cytometry does not require the compensation or spectral unmixing needed for conventional and full-spectrum flow cytometry, respectively.

The approach does have some drawbacks, including slower throughput than flow cytometry. The cells are also vaporized during acquisition, which prevents the cells from being utilized in downstream analyses. Despite these drawbacks, mass cytometry is quickly becoming the go-to platform for immune profiling and biomarker validation due to its ease of panel customization, high-number of parameters per panel, and sensitive mass spectrometry-based detection method.

Page Anchor: #which-cytometry-platform-is-right-for-you – Not Visible On Front

Which Technique is Right For You?

All three techniques are used in both academic and industry labs, occasionally in tandem!

Flow cytometry is a good choice for those interested in profiling a handful of immune cell types or for looking at a handful of markers on a single cell type. 

Spectral cytometry is a good choice for those interested in profiling more cell types and who plan on using the same or similar panels with limited changes between experiments.

Mass cytometry is a good choice for those interested in profiling the full immune landscape, those with limited or precious samples, or those who prefer the ease of panel customization that mass spectrometry-based detection methods can provide.

Where to go for help

At Teiko, our end-to-end platform utilizes mass cytometry as it allows us to easily customize our 35-marker base panels with up to 12 additional custom markers tailored to each customer project. Our team has over a decade of experience in every stage of mass cytometry analysis including panel development, sample processing, computational analysis and data interpretation. Our scientists have also previously worked with conventional flow cytometry and spectral flow cytometry platforms and are available to answer your questions about our experiences with all three.

You Might Also Like

References

  1. Bonilla, D. L., Reinin, G., & Chua, E. (2021). Full spectrum flow cytometry as a powerful technology for cancer immunotherapy research. Frontiers in Molecular Biosciences, 495.
  2. Hartmann, F. J., Babdor, J., Gherardini, P. F., Amir, E. A. D., Jones, K., Sahaf, B., … & Bendall, S. C. (2019). Comprehensive immune monitoring of clinical trials to advance human immunotherapy. Cell reports, 28(3), 819-831.
  3. Herzenberg LA, Parks D, Sahaf B, Perez O, Roederer M, Herzenberg LA. The history and future of the fluorescence activated cell sorter and flow cytometry: a view from Stanford. Clin Chem. 2002 Oct;48(10):1819-27. PMID: 12324512.
  4. Jameson, VJ, Luke, T, Yan, Y, Hind, A, Evrard, M, Man, K, et al. Unlocking autofluorescence in the era of full spectrum analysis: Implications for immunophenotype discovery projects. Cytometry. 2022; 101( 11): 922– 941. https://doi.org/10.1002/cyto.a.24555
  5. Levine, L. S., Hiam-Galvez, K. J., Marquez, D. M., Tenvooren, I., Madden, M. Z., Contreras, D. C., … & Spitzer, M. H. (2021). Single-cell analysis by mass cytometry reveals metabolic states of early-activated CD8+ T cells during the primary immune response. Immunity, 54(4), 829-844.
  6. Mardi, A., Meidaninikjeh, S., Nikfarjam, S., Majidi Zolbanin, N., & Jafari, R. (2021). Interleukin-1 in COVID-19 Infection: Immunopathogenesis and Possible Therapeutic Perspective. Viral immunology, 34(10), 679-688.
  7. McKinnon, K. M. (2018). Flow cytometry: an overview. Current protocols in immunology, 120(1), 5-1.
  8. Nolan, J. P., & Condello, D. (2013). Spectral flow cytometry. Current protocols in cytometry, 63(1), 1-27.Spitzer, M. H., & Nolan, G. P. (2016). Mass cytometry: single cells, many features. Cell, 165(4), 780-791.

Five things to look for in an immune profiling partner

Being able to leverage the strengths and skill sets of a strategic partner can mean the difference between finding a therapeutic breakthrough in your research pipeline or not. Make the most of your time and resources by choosing an immune profiling partner who can advance your oncology, autoimmune, or infectious disease pipelines. Here are five things to look for when evaluating an immune profiling partner.

Page Anchor: #immunology-expertise – Not Visible On Front

Immunology Expertise

It may seem obvious, but producing high-quality, interpretable data requires knowledge, skill, and experience.  Be sure your immune profiling partner has enough experience to perform quality work in a timely manner and can troubleshoot challenges that arise. Does your service provider understand the nuances of different cell types? The subtleties of manual gating? Gating and computational expertise in high [40+] dimensional immune datasets can mean the difference between finding and missing subtle signals in your data.

How can you judge expertise when scoping a new partnership?  Ultimately, the proof is in the pudding.  The scientific leadership of the organization should have a trail of high-impact publications in established peer-reviewed journals and demonstrate innovative ways of understanding and exploiting our immune system to treat disease. Their team should be experienced and confident enough in the “language” of their technical knowledge base to creatively expand and grow its potential versus someone who only conventionally applies what has already been done before.

Another consideration is the technology being used to complete the immune profiling.  The technique should make use of latest advances in science but at the same time must be properly vetted through the scientific process to ensure consistency and accuracy over time.  

For example, mass cytometry or cytometry time of flight (CyTOF) is a technique that employs antibodies coupled to isotopically pure metals to detect and measure more than forty cellular features with single-cell resolution.  It builds on the technology of flow cytometry to maximize resolution and parameterization (the number of markers that can be detected in a single cell). At the same time, the technique has been tried and tested and widely validated through rigorous research since becoming commercially available in 2009. Over the years, new techniques like SCAFFOLD [Single-Cell Analysis by Fixed Force- and Landmark-Directed] have been developed to visualize complex mass cytometry data. Powerful informatics techniques to make use of all the information mass cytometry data has to offer have been developed over the years by leaders in the field. Look for service providers that have expertise in the nuances of these different tools.

Page Anchor: #batch-effects-normalization – Not Visible On Front

Batch Effects Normalization

Batch effects arise from non-biological factors that influence data results, masking the relevant biological data necessary to move the research project forward. By using a barcoding set methodology, separate samples can be grouped together and analyzed in one tube, minimizing the variation between sets, or batches, that can develop from uncontrollable technical fluctuations.1  Such technical variability can arise from slight changes in the calibration of equipment or in the implementation of experimental procedures, such as staining, that are unavoidable when each batch is analyzed.2  

Equipment calibration fluctuations are detected and eliminated via normalization algorithms that are calculated based on the variation of standardized calibration control beads between batches, which would otherwise be identical.2  Likewise, the effects of slight differences in experimental technique, such as staining, are detected and eliminated using anchor, or reference, control samples.1,2 Technical and biological replicates applied to each batch are used as anchor samples.  A single donor, cell line, or tissue sample could be used as an anchor sample depending on the details of the study and its objectives.1  By means of computer analysis, transformation factors are then calculated to normalize anchor sample variation between batches.2  

Make sure your immune profiling company employs both instrument calibration controls and biological anchor samples to guarantee that data is normalized appropriately.  Doing so ensures that biologically relevant information can be clearly detected and data between batches is comparable.

Page Anchor: #quality-control – Not Visible On Front

Quality Control

Use of anchor, or reference, samples, calibration beads, and normalization algorithms are part of the broader picture of quality control.  Quality control must be implemented for all components of an experiment including the instrument, reagents, methods, and samples.3  Instruments should be checked daily to make sure they are functioning properly within specified parameters, using calibration beads and diagnostic checks.  Reagents must be tested for reliable performance, and methods must be consistent and standardized. Excellent quality control demands expert-level technical proficiency and problem-solving skills that only come from advanced training and experience.

Quality control extends to the handling and processing of your biological samples as well.  Biological specimen samples are precious, and it is critical that your immune profiling partner make every effort to ensure that they are handled properly to generate reliable data you can be confident in.   This includes quality control measures at every stage of sample processing, including on arrival, following fixation, and during data acquisition.

Regarding the handling of samples, disease stage and treatment can affect blood and PBMC (peripheral blood mononuclear cell) viability and quality.  Thus, a good immune profiling partner is one who has experience processing many different types of biological specimens (e.g. whole blood, PBMCs, dissociated tumor or tissue samples, tumor-infiltrating lymphocytes, and bone marrow aspirate) from a variety of sources (human, mouse, non-human primates) collected using a variety of techniques (fixed and frozen).

Page Anchor: #bioinformatics-pipeline – Not Visible On Front

Bioinformatics Pipeline

The complexity and volume of data from high dimensional single-cell analysis requires increasingly sophisticated computing technology.  Many important informatics algorithms have been developed throughout the 2010s.  

One of these is CLARA (Clustering LARge Applications) clustering for large cytometry datasets which allows the data to cluster into groups and can identify unique subsets that may be missed by conventional cytometry gating strategies. This can be paired with an algorithm like Cluster Identification, Characterization, and Regression (Citrus).7  This program enables detection of cellular characteristics associated with targeted outcomes, such as patient survival to identify statistically significant and biologically relevant biomarkers. 

Another algorithm is called Single-cell analysis by fixed force- and landmark-directed (Scaffold) maps.7  It employs a technique known as force-directed graphs, where the amount of likeness between cells functions as an attractive force while groupings are repelled by a repulsive force. The power of this bioinformatics technique is its ability to provide a 2-dimensional reference map of the immune system with static landmarks that can be used for easy comparison between samples or conditions. Changes to the system can then be better interpreted in their proper context and evaluated in comparison to other research study outcomes.

You’ll want an immune profiling partner that is familiar with a diversity of bioinformatics pipelines and may have even been a part of their development and validation. Computational approaches continue to evolve and a partner with a strong foundation who is continuing to evaluate modern approaches will ensure confidence and longevity of your analysis.

Page Anchor: #turnaround-time – Not Visible On Front

Turnaround Time

Time is precious and an important part of goal setting.  When you assess turnaround time, it is important to look for a company that will provide end-to-end support at every step of the process from data acquisition through delivery and interpretation of results.  Most contract research organizations (CROs) will cover the data acquisition, but leave the first mile and last mile up to you and your busy team. Look for a company that will work hand-in-glove with your existing scientific team to devise a detailed outline of the exact project scope, deadlines, and deliverables necessary to achieve your goals.  

Leveraging the skill and experience of the right immune profiling partner to scope your project could save you a great deal of time and expense in the long run by avoiding errors that would stall your project or force your team to go back to the drawing board.  Many CROs will leave you with raw data and excel spreadsheets.  Look for a partner that provides data analysis and interpretation to save your company critical time and resources that could be better spent elsewhere.

Where to go for help

Whether you’re in the final stages of evaluating immune profiling partners or just beginning your search, our team of Senior Scientists is available to help answer any questions in your consideration process. You can book a meeting directly on our Contact Us page.

You Might Also Like

References

  1. Schuyler RP, Jackson C, Garcia-Perez JE, Baxter RM, Ogolla S, Rochford R, Ghosh D, Rudra P, Hsieh EW. Minimizing batch effects in mass cytometry data. Frontiers in Immunology. 2019 Oct 15;10:2367.
  2. Rybakowska P, Alarcón-Riquelme ME, Marañón C. Key steps and methods in the experimental design and data analysis of highly multi-parametric flow and mass cytometry. Computational and Structural Biotechnology Journal. 2020 Jan 1;18:874-86.
  3. FlowMetric. Quality Control and Flow Cytometry: What is it and why do it? [Internet]. www.flowmetric.com. [cited 2022 Feb 16]. Available from: https://www.flowmetric.com/cytometry-blog/quality-control-and-flow-cytometry-what-is-it-and-why-do-it
  4. ‌Bagwell CB, Inokuma M, Hunsberger B, Herbert D, Bray C, Hill B, Stelzer G, Li S, Kollipara A, Ornatsky O, Baranov V. Automated data cleanup for mass cytometry. Cytometry Part A. 2020 Feb;97(2):184-98.
  5. Casado J, Lehtonen O, Rantanen V, Kaipio K, Pasquini L, Häkkinen A, Petrucci E, Hynninen J, Hietanen S, Carpén O, Biffoni M. Agile workflow for interactive analysis of mass cytometry data. Bioinformatics. 2021 May 1;37(9):1263-8.
  6. Abdelaal T, Höllt T, van Unen V, Lelieveldt BP, Koning F, Reinders MJ, Mahfouz A. CyTOFmerge: integrating mass cytometry data across multiple panels. Bioinformatics. 2019 Oct 15;35(20):4063-71.
  7. Spitzer MH, Nolan GP. Mass cytometry: single cells, many features. Cell. 2016 May 5;165(4):780-91.